
Overall, a falling Rupee redistributes gains and pains across stakeholders. Those who respond early with disciplined hedging, diversification, and balance-sheet prudence are better positioned to convert currency volatility from a risk into a manageable variable.
“When financial sectors are small and capital is mobile, floating exchange rates spell massive currency volatility. When a lot of foreign capital flows in, a freely floating exchange rate rises sharply, wreaking havoc for domestic banks and exporters alike.” Zanny Minton Beddoes
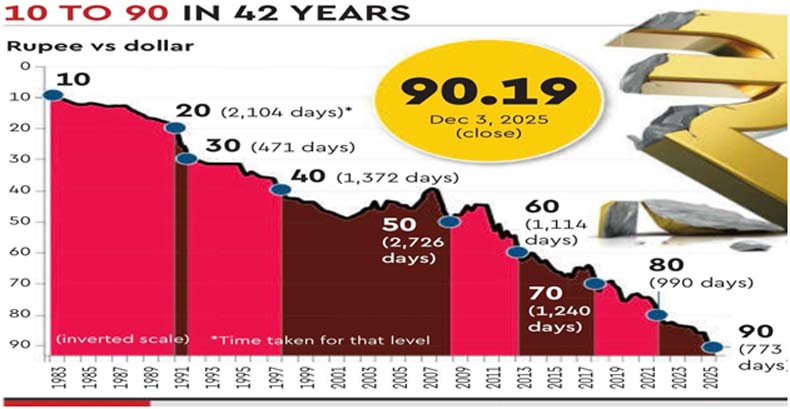
The Indian Rupee’s drop to ₹90.70 per US dollar- a historic low- on December 16, 2025, sparked concern and headline risk. This made it the worst-performing currency in Asia this year. Yet, when placed in a historical and an international context, the move reflects a clear pattern of a long-term tendency toward gradual depreciation marked by cyclical bouts of volatility. The latest decline is driven by
- trade-policy uncertainty due to the absence of a comprehensive bilateral trade agreement (BTA),
- sustained capital outflows amid higher US rates, with Foreign Institutional Investors (FIIs) net sellers in the Indian equity market, withdrawing ₹17,821 crore between December 1 and December 15, 2025, and a vicious cycle where the Rupee depreciates because shrinking Dollar returns for FIIs encourage them to withdraw more money, which further weakens the currency,
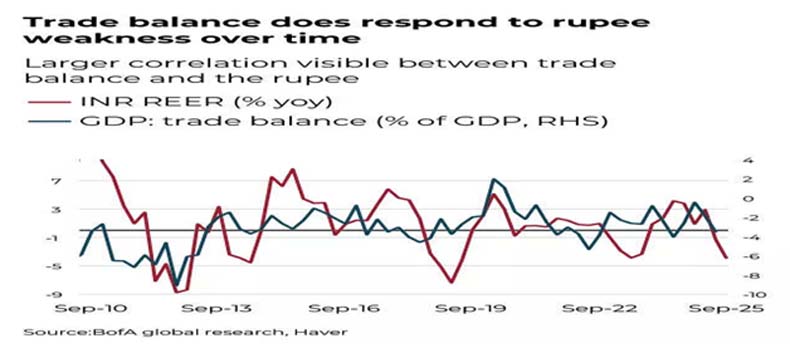
- and a near-term demand-supply imbalance in dollars, amplified by India’s structural energy import dependence that the currency struggles to withstand, despite an improved trade deficit. A REER (Real Effective Exchange Rate)-based analysis indicates that nominal INR slide against the USD does not necessarily mean a loss of external competitiveness.
Market Snapshot
| Indicator | Status/Value | Context |
|---|---|---|
| Rupee (INR) | ₹90.70 per USD (New Low) | Opened at ₹90.5 and hit a low of ₹90.79 before recovering slightly to close the day. |
| Dollar Index (DXY) | 98.32 (0.08% Lower) | The Dollar’s overall strength was slightly down, highlighting the specific weakness of the INR. |
| FII Activity | Sold ₹1,114.22 crore on Friday | Continued net selling adds pressure on the currency. |
| Forex Reserves | $687.26 billion (Up $1.033 billion) | Despite the small rise in RBI’s reserves, market sentiment remains bearish on the Rupee. |
Myths versus Realities
Let us clear some common misconceptions. A new low does not mean a new crisis. It must be realised that new lows tend to occur during dollar up-cycles; what matters is whether moves are disorderly and whether macro buffers (reserves, inflation, external debt metrics) are adequate. It is held that weak INR always hurts competitiveness. But it needs no clairvoyance to perceive that competitiveness is better assessed via REER; nominal USD weakness may coexist with stable or improved external competitiveness. It is also sometimes averred that the Policy must defend a level. But we cannot be oblivious to the fact starkly brought out by theoretical underpinnings and cross-country empirical evidence that defending levels can be costly and counterproductive. Smoothing volatility and anchoring expectations are more durable.
Gradual Depreciation, Episodic Volatility
Over the past several decades, the Rupee has exhibited a steady and persistent tendency to depreciate against the US Dollar, with an average annual rate of roughly 3.5–4 %. A transition from levels near ₹10 per Dollar in the early post-independence decades of India’s economic history to around ₹90 today broadly aligns with this long-run trend. This is not a “break with history” so much as the latest point on a long slope—a slope shaped by differential inflation, productivity gaps, India’s structural current account constraints, and the Dollar’s reserve-currency premium. In other words, the current exchange rate does not represent a sudden rupture or an unprecedented break from historical norms, but rather the cumulative outcome of a gradual and enduring process.
Recent Rupee Depreciation – Connecting the Dots
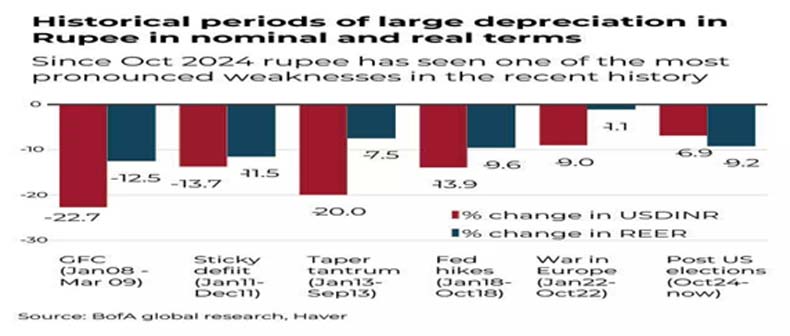
The rupee depreciated against the Dollar by 4.7% on a yoy basis in 2025, and by 12.1% in REER terms. The recent phase of depreciation has, however, been sharper, driven by a confluence of near-term global and domestic factors. Elevated global crude oil prices have significantly worsened India’s import bill, intensifying pressure on the current account and increasing demand for dollars. To place matters in perspective, the Rupee had weakened by 8.7% in 2018, 14% in 2013, and 18.7% in 2008, the previous episodes of large-scale depreciation in the Rupee.
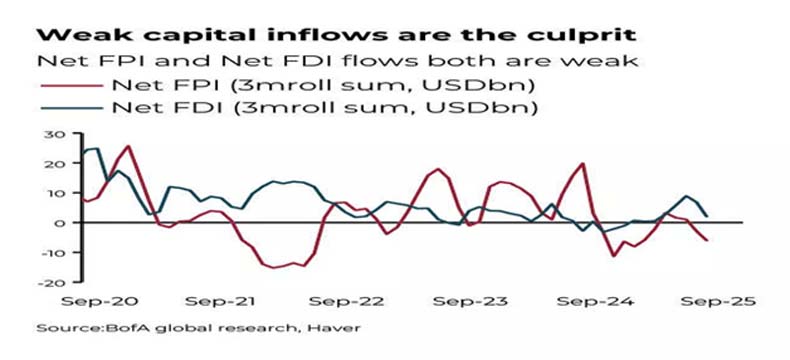
Capital Inflows
At the same time, capital inflows, particularly volatile portfolio flows, have weakened or turned episodic, reducing an important source of support for the rupee. Heightened uncertainty surrounding global trade dynamics, geopolitical tensions, and the future path of monetary policy in advanced economies has further amplified risk aversion. In such an environment, emerging market currencies, including the Rupee, tend to be hit disproportionately as investors retreat toward perceived safe havens.
A key driver of this global dynamic has been the persistence of higher interest rates in the United States. Rising US Treasury yields have made dollar-denominated assets increasingly attractive, prompting portfolio rebalancing in favour of the dollar and triggering capital outflows from emerging market economies (EMEs). For India, these global forces interact with structural features of the economy—most notably its dependence on imported commodities, especially petroleum, oil and lubricants (POL). Higher oil prices mechanically widen the trade deficit, sustain elevated demand for Dollars, and exacerbate the pressure on the Rupee.
Geopolitical uncertainties, delays or frictions in trade negotiations, and episodic bouts of global risk-off sentiment further reinforce these pressures by channelling global capital toward the dollar and away from emerging markets.
Rupee Depreciation Not Linear
“Nations are not ruined by one act of violence, but gradually and in an almost imperceptible manner by the depreciation of their circulating currency, through its excessive quantity.” Nicolaus Copernicus
Crucially, depreciation is not linear. The pace and volatility of exchange rate movements vary considerably across years, reflecting a complex interplay of domestic macroeconomic conditions, fiscal and monetary policy choices, and shifting global cues. Periods of sharp weakening (e.g., 2008, 2013, 2018) have been followed by phases of stability or partial retracement. The 2025 move—about 4.7% yoy in nominal terms and 12.1% in REER terms—is on the sharper side but still within the historical range of stress episodes (e.g., 8.7% in 2018; 14% in 2013; 18.7% in 2008). Episodes of sharper depreciation are often followed by periods of relative stability or even appreciation. However, when examined over longer time horizons—across different political regimes and successive RBI governors—the dominant pattern remains one of gradual but persistent decline. Recognising this continuity is essential for a balanced and holistic assessment, as it shifts the focus from short-term fluctuations or episodic policy debates to deeper structural and global drivers.
Assessing Rupee Movements through the REER Framework
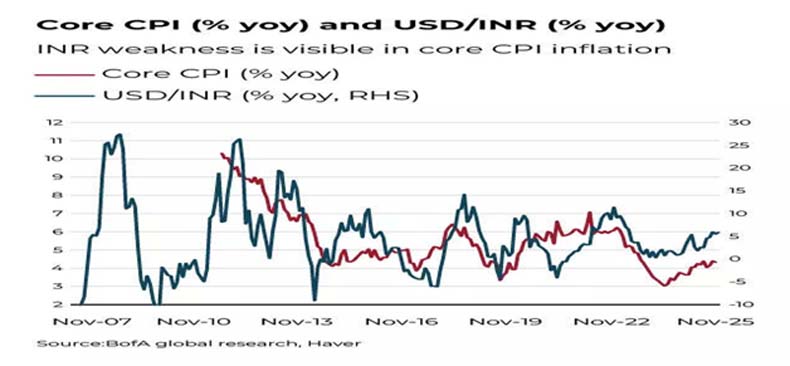
From this perspective, a weakening nominal rupee against the Dollar does not automatically imply a commensurate loss of competitiveness. If inflation-adjusted movements against other key currencies remain broadly stable, India’s relative price competitiveness in global markets may be largely preserved. Consequently, assessing rupee movements through the REER framework allows for a more nuanced understanding of currency dynamics, one that distinguishes between headline depreciation and underlying external balance considerations.
The Global Overlay: Rates, Risk, Oil—and the INR
1. Global backdrop: why USD strength persists
- Higher-for-longer US rates: Elevated front-end policy rates, sticky term premia, ongoing QT, and heavy Treasury supply keep US yields attractive. This pulls global portfolios toward USD assets and away from EM duration/FX.
- The “dollar smile” in action: Strong US growth and periodic risk-off shocks both support the USD—via carry and safe-haven demand, respectively.
- Transmission to EM: Tighter global financial conditions lift funding costs, compress risk appetite, and reduce the marginal buyer of EM assets. The result is broad EMFX underperformance and more volatile local rates.
2. Risk-off dynamics and safe havens
- Flight-to-quality episodes and geopolitical uncertainty redirect flows into US Treasuries, the USD, and a few other havens.
- EM currencies typically bear a disproportionate share of the adjustment because FX is a quicker shock absorber than domestic wages/prices, trade and commodity invoicing are USD-centric, and foreign participation in EM local markets is pro-cyclical and more flow sensitive.
3. Oil as a terms-of-trade shock for India
- India’s energy import dependence: Petroleum, oil, and lubricants (POL) dominate the import bill. When oil rises, the merchandise trade deficit mechanically widens and USD demand increases.
- Balance-of-payments channel: Higher oil raises the current-account deficit (CAD) unless offset by services surplus, remittances, or pricing discounts.
- Inflation channel: Fuel and freight costs leak into core via distribution and input costs; currency pass-through adds to the impulse if the INR weakens.
- Rule-of-thumb sensitivities suggest that a sustained +$10/bbl move in crude can widen India’s CAD by ~0.3–0.4% of GDP over a year, all else equal; FX impact is state-contingent: terms-of-trade shocks combined with a strong USD often nudge INR weaker, though the magnitude depends on policy response and concurrent capital flows.
4. What’s generic EM vs. India-specific
- Generic EM pattern:
- Higher US yields → stronger USD → tighter financial conditions → weaker EMFX and local risk assets.
- Risk-off → outflows from EM → wider spreads, weaker FX, pro-cyclical tightening.
- India-specific features:
- Scale of POL dependence: Oil price swings have outsized effects on trade, inflation, and FX demand compared with more commodity-neutral EMs.
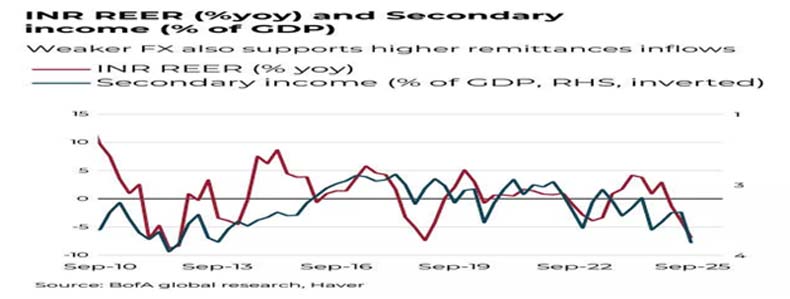
- Services buffer: A large, resilient services surplus (IT, business services) and strong remittances help cushion oil shocks.
- External debt profile: Relatively moderate external leverage and short-term external debt/reserves ratios reduce rollover risk.
- Market structure and policy credibility: Deeper local markets and a credible inflation-targeting regime help anchor expectations.
5. The policy mix: cushioning volatility
- The RBI toolkit:
- FX intervention: Spot and forward/NDF markets to smooth disorderly moves and lean against one-way positioning.
- Liquidity operations: VRRR/OMOs to balance domestic liquidity while managing the monetary stance.
- Rate signalling: Calibrated policy to anchor inflation expectations without unduly choking growth.
- Macroprudential measures: Managing external commercial borrowings and short-term leverage risks.
- External buffers: Maintaining reserve adequacy, encouraging prudent hedging by corporates/importers.
- Communication: Guidance that prioritizes inflation control and financial stability anchors term premia and FX expectations.
- Fiscal/price policies:
- Excise duty adjustments and managed pump prices can smooth pass-through from global oil to headline CPI.
- Targeted subsidies (e.g., LPG) and fertilizer support mitigate real-income shocks.
- Hedging and microstructure:
- Importers (especially OMCs) hedge oil and FX exposures; better corporate hedging reduces pro-cyclical USD demand.
- Trade settlement diversification (including discounted crude purchases and non-USD invoicing where feasible) can modestly reduce immediate USD needs.
- Buffers and inflows:
- Substantial FX reserves provide space to counter excessive volatility.
- Ongoing inclusion of India’s local-currency government bonds in major global indices increases the potential base of structural investors, helping offset outflows during risk-off—while also making local rates more sensitive to global duration shocks.
Given the magnitude of the issue, coordinated and concerted structural measures like deeper INR invoicing and settlement, where feasible, energy strategy-mix diversification, strategic petroleum reserves, long-term contracts, and export competitiveness via logistics, compliance simplification, and productivity gains are needed with a sense of urgency.
6. Implications for the INR and local markets
- Baseline: With higher-for-longer US rates and episodic risk-off, the global overlay tends to bias INR weaker and more volatile during oil upswings.
- Offsets: Services surplus, remittances, bond-index-related inflows, and active policy management can limit the amplitude and duration of INR depreciation.
Triggers to Monitor
The movement of currency is a function of various forces and factors. Some important issues, which need to be identified and isolated, are US real yields and dollar broad indices (global overlay strength) and Fed guidance; shape of the US soft-landing narrative; Brent crude trajectory and OPEC+ supply discipline; and FII/FDI flow trends and domestic mutual fund absorption. There are also issues of RBI’s liquidity stance and FX operations (spot vs. forwards); progress on trade negotiations and INR settlement pilots; crude price level and term structure; India’s monthly trade data (oil vs. non-oil balance), services exports, and remittances; shipping/freight costs; Portfolio flow trends (equity vs. debt), especially as index inclusion phases progress; fiscal fuel tax policy and pump price adjustments and India’s inflation prints and pass-through to fuel/food for a holistic perspective and assessment.
In sum, the current global setup, which is characterised by elevated US yields, intermittent risk-off, and oil volatility, reinforces the classic EM playbook of stronger USD, softer EMFX. For India, the POL-heavy import structure amplifies the trade and FX impact when oil rises. What’s different for India is the combination of buffers (services surplus, remittances, reserves), policy credibility, and an evolving investor base (index inclusion) that together tend to smooth, rather than prevent, INR adjustment.
Why REER Matters
Focusing solely on USD/INR can be misleading. The REER adjusts for inflation differentials and weights trading partners, giving a better gauge of price competitiveness. A simplified representation of a REER index is:
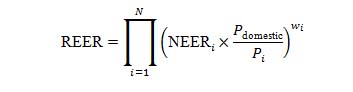
- NEER = nominal effective exchange rate vs. partner i
- Pdomestic, Pi = price levels (e.g., CPI, WPI)
- wi = trade weights
This implies that a weaker USD/INR does not automatically imply lost competitiveness if India’s inflation-adjusted price relative to trading partners is stable. REER helps separate headline USD moves from underlying external balance considerations.
Investigating the Current Trajectory
A granular examination reveals that the 2025 depreciation of 4.7% yoy (nominal) and 12.1% (REER) reflects both domestic factors (trade-policy uncertainty, importer USD demand) and global ones (US yields, risk sentiment, oil). Portfolio flows have turned episodic, reducing a key stabiliser. Despite higher FX reserves providing shock absorption, near-term sentiment remains cautious.
Policy Response
The Rupee’s slide to ₹90.70 per USD is unsettling but not aberrant. It fits a long-run pattern of measured depreciation interrupted by cyclical stress, now intensified by trade-policy uncertainty, higher-for-longer US rates, episodic capital outflows, and India’s energy import bill. A REER-centric lens tempers alarmism by distinguishing nominal USD moves from true competitiveness. The appropriate policy response is to preserve orderly markets, anchor inflation expectations, and continue structural reforms that bolster productivity, energy resilience, and external buffers.
Scenario Mapping
The baseline is gradual stabilization with elevated two-way volatility. USD/INR trades in a wider band as global yields peak and policy visibility improves, REER drifts toward medium-term averages. Faster clarity on trade agreements, softening oil, benign US data enabling a dovish shift, resumption of portfolio inflows, strong services exports, and remittances will provide tailwinds for INR. Renewed oil spike; sticky US inflation; sharper risk-off; acceleration in FII outflows; flare-ups in geopolitics could act as headwinds.
Concluding Observations
Let us now examine, in a more structured manner, the stakeholder-wise implications and strategic playbooks in an environment of a weakening rupee. Importers, particularly those dependent on energy, metals, fertilisers, chemicals, and electronic components, face immediate cost pressures as input prices rise in rupee terms. Their priority should be to raise hedge ratios on dollar payables, while avoiding bunching of maturities by staggering hedge tenors across the near and medium term. Firms should also actively explore natural hedges, such as passing through USD-linked pricing where feasible, increasing offshore revenues, or aligning export receivables with import payables. Improving supply chain efficiency and renegotiating contracts can further cushion margin erosion.
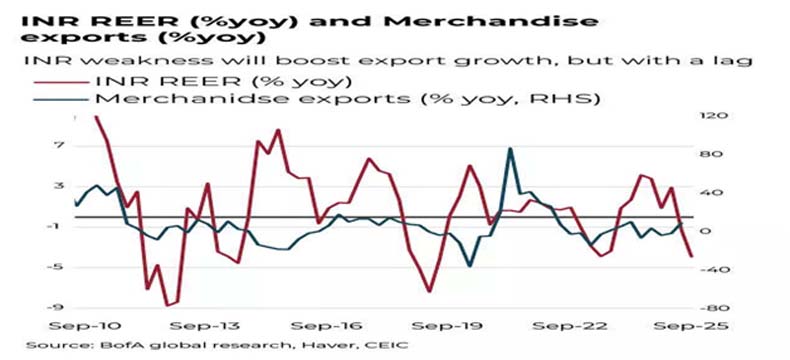
Exporters, by contrast, benefit from enhanced rupee realizations. However, this advantage can be transient if volatility intensifies. Export-oriented firms should therefore lock in favourable rates through forward contracts on receivables, especially for near-term cash flows, while maintaining some flexibility for longer tenors. Market diversification—across geographies and currencies—remains critical to mitigate overdependence on a single currency or region, particularly the US dollar. Firms with pricing power should also revisit invoicing strategies to optimise currency exposure.
Corporates with USD-denominated debt face a direct balance-sheet impact as servicing costs rise. Such firms should proactively review covenant headroom, stress-test leverage and interest coverage ratios under weaker INR assumptions and increase hedge coverage on both principal and interest payments. Where liquidity permits, pre-funding or refinancing at opportune windows can reduce rollover risk. Aligning foreign-currency liabilities with foreign-currency earnings remains the most durable risk-management strategy.
From an investor perspective, a stable policy framework and credible central bank intervention can support local fixed-income assets, particularly at the shorter end of the yield curve. However, investors must remain alert to mark-to-market risks on long-duration bonds if currency volatility spills over into inflation expectations or global risk sentiment. In equities, screening should favour FX beneficiaries—notably IT services, pharmaceuticals, and select engineering exporters with substantial dollar revenues—alongside firms with low imported input intensity and strong pricing power. Highly leveraged companies with unhedged foreign liabilities warrant caution.
Finally, households are indirectly affected as imported inflation raises the prices of fuel, edible oils, electronics, and other tradables. This can compress real disposable incomes, especially if second-round effects emerge. Households with planned foreign-currency expenditures, such as overseas travel, education, or medical expenses, should consider staggering or pre-booking FX outlays where timing is flexible and use simple hedging tools or advance remittances to manage cost uncertainty.
ABOUT THE AUTHOR
 Dr. Manoranjan Sharma, Chief Economist, Infomerics Ratings is a globally acclaimed scholar. With a brilliant academic record, he has over 350 publications and six books. His views have been published in Associated Press, New York; Dow Jones, New York; International Herald Tribune, New York; Wall Street Journal, New York.